
Let us be honest, as a electronics engineers, students, hobbyists we all desired for an oscilloscope and they are expensive. Although a DIY scope couldn't beat an professionally made scopes in the market, we all needed an inexpensive and a basic one to play around to learn and grow.
The answer to this is now answered by an open source project code-named Scoppy.
Raspberry Pi Pico Oscilloscope for your Smart Phone or Tablet, Scoppy Oscilloscope
Let us learn how to make a Raspberry Pi Pico based Oscilloscope and logic analyzer powered by an Android Smart phone or Tablet. An oscilloscope is the most essential tool in all of electronics. It is used to visualise electrical signals varying over a time period. An Oscilloscope becomes essential to analyze signals such as Sinusoidal, PWM, etc, for testing analog or digital sensors, and also for testing timing circuits, wireless devices, function generators, and so on.
A Multimeter and an Oscilloscope are two very core measurement tools used extensively for analyzing and diagnosing electrical and electronic circuits, components, devices, etc. Multimeters are cheap and Oscilloscopes are too expensive and Scoppy answers this at an expense of just 5 dollars. Both firmware and Scoppy App are free to download. Scoppy Oscilloscope firmware can be downloaded from Github, for Raspberry Pi Pico (and Pico W) and the Android app from Google Playstore.
Scoppy App has got lots of features, so we shall explore most of them here.
Post building the Raspberry Pi Pico Oscilloscope, we shall do the following tests,
- Capacitor charge and discharge testing.
- Testing an Analog Sensor and
- We will be measuring the Arduino PWM Signal.
Making of Raspberry Pi Pico Oscilloscope:
We need an Android based Smartphone / Tablet for this build with following basic specs,
- Android version 6.0 (Marshmallow) or higher
- Supports USB OTG.
- Scoppy Android App installed from Google Playstore.
OTG stands for On the Go – The OTG feature is available on most modern phones and tablets. The Scoppy Oscilloscope App won’t run if a lower android version is running on your device or if your device doesn’t support OTG. So, double-check your device before you start working on this Oscilloscope.
Building the Scoppy Pico hardware
Components needed for Scoppy DIY:
Install the Firmware on Raspberry Pi Pico:
Download the Scoppy Oscilloscope firmware from Github.
Once the firmware is downloaded, next, press and hold the boot selection button on your Raspberry Pi Pico board and connect it to your Laptop or Computer. It will mount as a Mass Storage Device RPI-RP2. Release the BOOT Selection button after your Pico is connected. Next, copy the uf2 file (firmware). Right-click on the storage device RP1-RP2 and paste the file. Now, you can go ahead and disconnect your Pico board. If you face any issues then you can watch the video tutorial given at the end of this article.
Install Scoppy Android App:
Open Play Store. Search for the Scoppy Oscilloscope and Logic Analyzer and install it. The demo version is free of cost. The free (zero cost) version of the Scoppy app is limited to one channel. To enable extra channel(s) and remove all advertising, a small in-app purchase is required (approx. USD1 for a yearly subscription or USD2 for a lifetime purchase – exact price depends on your location)… You can see my Oscilloscope and Logic Analyzer App has been installed.
Initial Testing:
For the initial testing, you can connect GP22 directly to the ADC pin GP26 which is channel1.
The GP22 generates a 1kHz Square wave with a duty cycle of 50%. Now, you can connect your cell phone with the Raspberry Pi Pico using USB OTG adapter.
While you connect your cell phone with the Raspberry Pi Pico; allow Scoppy to access the Pico.
You can see its working. If you can see this PWM signal then it means you have done everything correctly. Anyways, if you want to use an external signal source then you will need to connect some resistors. Let me explain this with the help of a circuit diagram.
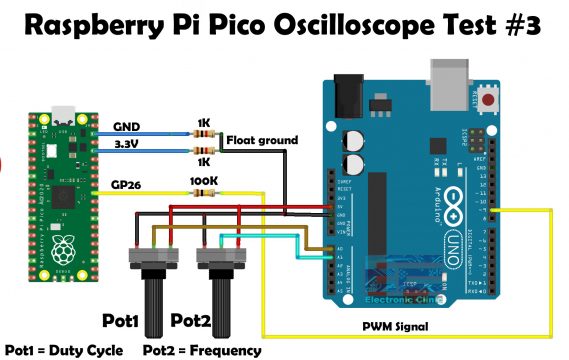
Raspberry Pi Pico Oscilloscope Circuit Diagram:

Attach the +ve output of your signal source to GPIO26 of the Pico ( Signal Input) and the ground to gnd. This will allow you to measure signals between 0V and 3.3V. Of course, the signal voltage should be within the allowed range of the ADC pins of the RP2040. You will need this 100K ohm resistor between the signal source and the Pico ADC GP26 and GP27. Since on the demo version, I am only allowed to use channel1 so that’s why I have connected only one resistor with the GP26 which is channel1. This 100K ohm resistor will limit the current through the Raspberry Pi Pico ESD diodes in case you accidentally apply a voltage higher than 3.3 volts.
The two 1k ohm resistors connected with the GND and 3.3V pins of the Raspberry Pi Pico make the voltage divider circuit and we are using the divided voltage as our ground reference.

I connected all three resistors as per the circuit diagram and now I am going to explain how to use the Scoppy App.
How to use Scoppy App:
Before, you connect, your cell phone with the Raspberry Pi Pico, first, make sure you turn ON the OTG. Now, connect your android smart phone with the Raspberry Pi Pico using USB OTG Adapter. The Scoppy App will ask for the permission “Allow Scoppy to access Pico?” simply press on the OK button.

You can see this button on the bottom left side, press this button and then click on the change input. You will see two input options Demo and USB; make sure you select USB.

Next, you can see channel1 and channel2. By default, Channel1 is ON and channel2 is OFF. The channel2 won’t turn ON until you upgrade to premium. So, forget about the channel2, we can’t use it on this free version. Anyways, click on the channel1.
You will see,
- Switch off
- Measurements
- Select input voltage range
- Settings.
You can Switch OFF and Switch ON the channel1.
If you click on the measurements, you will see two options; On-screen and Snapshot.

Let’s click On-screen.

From here you can control which measurements you want to display on the screen. Using this top right button you can turn ON all the values or you can turn off all the values. We also have these check boxes, let’s say you don’t want to display the Vpp value, simply uncheck this box and press on the Ok button. If you want to display it again, repeat the same process…
If you click on the Snapshot, it will give you a complete Measurement Snapshot of Channel1.

You can take a screenshot of these values for the later analysis.
Now, let’s check the settings, under the settings we have only Voltage range, so let’s go ahead and click on this.

Over here you can select the minimum and maximum voltage. I am going to leave these values as it is.
Now, let’s check this Trigger which is by default selected for Channel1. If you click on the trigger you will see these four options.
- Channel
- Level
- Type
- And Pre-trigger samples.
Channel:
Let’s first start with the Channel. If you click on the channel, you will get two options and you can only select one of these options. You want to use Trigger channel1 or Trigger channel2? In my case as I am using free app so I will go with the Trigger Channel1.
Level:
Now, by clicking on the Level, you will see a slider and by using that slider you can select the Trigger Level voltage.
Type:
Now, by clicking on the Type, you can select between the Rising edge and falling edge.
Pre-trigger samples:
Now, by clicking on the Pre-trigger samples, you will see Pre-trigger samples to select from.

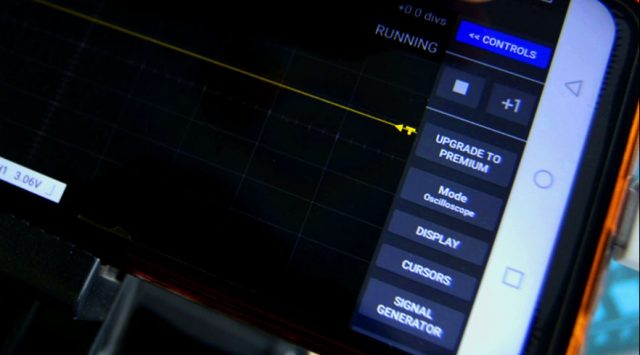
On the right side of the Scoppy App, you can see lots of buttons and you should definitely know about these buttons.
Stop Button:
If you click on the stop button, it will freez or stop the graph, this is quite a handy feature, you will need it for checking your graph.
SINGLE Button:
If you click on the SINGLE button. SINGLE CAPTURE IN PROGRESS is displayed on the screen, a ten seconds timer is activated and any activity that happens in this ten seconds duration will be displayed on the graph. The graph is stopped for you, it’s will not move and you can easily study the graph. When you are done, then again you can click on the RUN button and it will start again.
Menu>> Button:
If you click on the Menu button. You will see
- Stop/Play button.
- +1 button.
- UPGRADE TO PREMIUM.
- Mode Oscilloscope.
- Display.
- Cursors.
- Signal Generator.
- Export.
- Settings.
Play/Stop button:

You also got this stop and play button over here.
+1 button:
This +1 button has the same function as the Single button.
Upgrade to Premium:
You can use this Upgrade to Premium button, if you want to purchase this App…
Mode:
The Scoppy App has two modes,
Oscilloscope and Logic Analyzer.
So, click on the Mode button and select Oscilloscope or Logic Analyzer as per your requirement.
Display Button:
If you click on the display button, you will see by default YT is selected, the XY and XY + YT can only be selected when both the channels are enabled; and you know both the channels can only be enabled on the premium version. So, on the free Scoppy App, you can continue with the YT.
CURSORS in Oscilloscope:
You can measure waveform data using cursors. Cursors are horizontal and vertical markers that indicate X-axis values (usually time) and Y-axis values (usually voltage) on a selected waveform source. I will practically explain how to use Cursors on Oscilloscope while testing some circuits.
Signal Generator:
Scoppy App also includes a very basic PWM signal generator that you can access by clicking on the Signal Generator button. You can select the type of signal, Square or Sine PWM. By default, the frequency is set to 1kHz, which you can change as per your requirement or you can enter a frequency of your choice by clicking on the custom. For now, I will continue with the 1kHz frequency. The signal is output on GP22 of the Raspberry Pi Pico. I already demonstrated this during performing my initial test.
Export:
Export only work on the premium version.
Settings:
If you click on the settings, you can change the Trace line width, Grid line width, and if you want to keep the screen ON. So, that’s all about how to use the Scoppy App. Now, I am going to perform some tests.
Raspberry Pi Pico Oscilloscope Testing:
 |
| Capacitor charging and discharging: |
I have this very basic RC circuit. You can see a 10K ohm resistor and a 10uF electrolyte capacitor are connected in series. A pushbutton is connected in parallel with the Capacitor. When the button is open the capacitor is charged using this 10k resistor and when the button is pressed the charge stored in the capacitor directly goes to the ground so, 0V will appear on the GP26 pin of the Raspberry Pi Pico which is the signal input. So, let’s see on the Raspberry Pi Pico based Oscilloscope; how much time it takes for the 3.3v to charge this 10uF capacitor through this 10k ohm resistor.
I completed my connections as per the circuit diagram, and now I am going to connect Raspberry Pi Pico with the Cell phone using a USB OTG adapter as previously explained.

A straight line on the top means, the capacitor is fully charged. If I am going to click on the push button the capacitor will completely discharge and if I release the button the capacitor will start charging. Our capacitor charging graph is quite similar to a standard capacitor charging graph. As I am using a small value capacitor, that’s why it quickly charges. So, the capacitor charging time depends on the voltage, resistor, and size of the capacitor. Anyways, on the screen, you can see the minimum and maximum voltage and other measurements. Let’s use Cursors to find out how much time it takes to charge this capacitor.
Adjust the vertical lines y1 and y2 and it will give you the time difference. So this capacitor takes around 577msec to completely charge. This is simply amazing. With this Raspberry Pi Pico Oscilloscope you can see in real time how a capacitor charges and discharges.
Testing an Analog Sensor:
Now, I am going to test a Variable resistor or Potentiometer which I am going to use as the analog sensor. Let’s take a look at the Circuit Diagram.
Raspberry Pi Pico Oscilloscope Analog Sensor Test:
The middle leg of the potentiometer is connected with the signal input. The rightmost leg of the potentiometer is connected with 3.3 volts and the leftmost leg is connected with the GND. You might have noticed one thing, that is, this time I am not using the float ground. If you are using 3.3 volts then there is no need to use this voltage divider. You can follow the same connections for all 3.3V supported analog and digital sensors.
I want to perform this test to check the minimum and maximum voltage of the potentiometer. So, let go ahead and perform the test.
So, you can see the minimum voltage is +0.06V volts and the maximum voltage is +3.07 volts. You can see when I rotate the Knob of the potentiometer all the way to the left, still, there is some voltage drop and this is good, the voltage and ground will never short. In the same way, you can check other analog sensors. Now, let’s measure the PWM signal from an Arduino board.
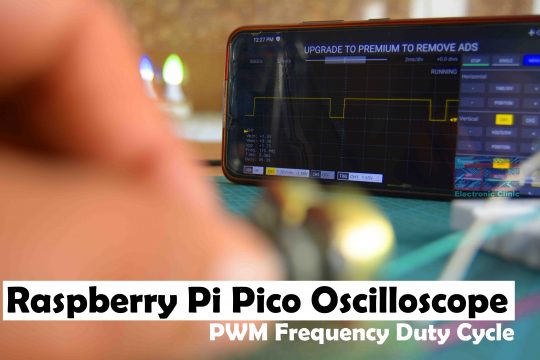
Arduino PWM Signal:
In this next example, I am going to use Arduino as the Signal Generator. I will generate different PWM frequencies and I will also change the duty cycle.
Arduino has multiple PWM pins and the normal PWM frequency which you can generate on any of these pins is 490Hz. Pins 5 and 6 are capable to generate PWM frequencies up to 980Hz. So, I will be monitoring the normal PWM frequency 490Hz, I don’t want to complicate things. With Arduino, you can generate PWM frequency up to 4Mhz.
The maximum frequency you can achieve is clock / 4, by setting the prescaler to 1 and TOP to 3 in fast PWM mode – a lower value isn’t allowed. This will give you a 4 MHz PWM with 2 bit resolution. It can be on 0%, 25%, 50%, or 75% of the time. For now, let’s forget about this maximum frequency and we will continue with the 490Hz normal frequency. So, let’s take a look at the circuit diagram.
Raspberry Pi Pico with Arduino PWM generator circuit diagram:

I am generating a PWM signal on pin 9 of the Arduino and as you can see it’s connected to the 100k ohm resistor. I am using Potentiometer 1 to control the Duty cycle and potentiometer 2 to control the frequency. Everything else remains exactly the same. I connected everything as per the circuit diagram and now, let’s take a look at the Arduino PWM frequency generator programming.
Arduino PWM Frequency Generator Programming:
#include<PWM.h>
int32_t frequency = 50; // frequency in hertz
int Duty_Cycle_Pot = A0;
int Frequency_Pot = A1;
int PWM_Pin = 9;
void setup()
{
  InitTimersSafe();
  bool success = SetPinFrequency(PWM_Pin,frequency);
  if(success)
  {
    pinMode(Duty_Cycle_Pot, INPUT);
    pinMode(Frequency_Pot, INPUT);
  }
}

void loop()
{
  int Duty_Cycle = analogRead(Duty_Cycle_Pot);
  Duty_Cycle = map(Duty_Cycle, 0, 1023, 0, 255);

  int Set_Frequency = analogRead(Frequency_Pot);
  Set_Frequency = map(Set_Frequency, 0,1023, 1, 490);

  SetPinFrequency(PWM_Pin,Set_Frequency);
  pwmWrite(PWM_Pin, Duty_Cycle); // 128 SHOW THE DUTY CYCLE WHICH IS 50% AT 128.
                                //THE ON TIME AND OFF TIME CAN BE VARIED AS WE
                                //CHANGE THIS NUMBER
}
Inside the setup() function, I set both the potentiometers as input.
Inside the loop() function, first I read the Potentiometer 1 and then I map it’s value. Next, I read the Potentiometer 2 and then I map its value. I can set any frequency between 1 and 490. This is the normal frequency which you can generate on PWM pin 9 of the Arduino. I have already explained this in very detail.
Finally, we set the frequency and the duty cycle. So, that’s all about the programming. Now, let’s go ahead and check this in action.
You can see, the minimum and maximum voltage and also the frequency. You can see change in the duty cycle as I rotate the knob. Now, let’s go ahead and change the frequency.
 |
| Raspberry Pi Pico Oscilloscope |
It’s simply amazing. What else you want from a 5 dollars Oscilloscope? If you want to learn how to use an oscilloscope, Frequency Generator, and Logic Analyzer then this Raspberry Pi Pico based Oscilloscope is perfect for you.
Logic analyzers are the best tools for measuring and viewing digital electronic signals, and digital protocols like I2C, SPI, and Serial.
The specifications of this oscilloscope are not so impressive. It features a maximum sampling rate of 500kS/s shared between two channels. The resolution in time/div is 5us to 20s. The memory depth ranges between 2kpts and 20kpts (K for “thousand” pts for “points”) in run mode shared between channels and up to 100kpts for single-shot captures. It depends on the sampling rate. Scoppy can also work as an 8-channel logic analyzer with a sample rate of 25MS/s. The input voltage range is limited between 0 and 3.3V, and the signal to be analyzed must be within this allowed range. For measuring out-of-range voltages, you will need analog circuitry like a voltage divider or something more complex, depending on your requirements.
DSO-500K
The DSO-500K is a 2-Channel 500kS/s oscilloscope with Wi-Fi and USB connectivity.

The DSO-500K uses our highly rated Scoppy Android app to display the waveform data and control the oscilloscope.
Features and Specifications
- Up to 500kS/s sample rate (250kS/s with both channels enabled)
- Maximum analog bandwidth: 150kHz
- Record length: 2048 samples per channel in RUN mode, 100kS total for single shot captures
- Input Impedance: 1MΩ / 22pF
- Maximum Input voltage range: +/- 6V (1X probes)
- Coupling: AC/DC
- Connectivity: USB, Wi-Fi
- Display Modes: YT, FFT, FFT+YT, X-Y, X-Y+YT
- Trigger Types: Rising edge/falling edge
- Trigger Modes: Auto/Normal (Run Mode + Single captures)
- Cursors: YT and FFT horizontal and vertical cursors
- On-screen measurements: Vmin, Vmax, Vpp, Frequency, Period, Duty
- Snapshot measurements (screen or sample record): Mean, DC RMS, AC RMS
- Export data format: CSV
- Signals can be input via 0.1” header pins or BNC connectors
- Signal generator - square wave up to 1.25MHz, sine wave - 1kHz
- AC and DC coupling of the input signals
- Indicator LEDs: Status, Wi-Fi and Trigger
- FFT Window functions: Hann, Hamming, Blackman, Rectangle
- FFT Vertical units: dBm, dBmV, V
Logic Analyzer: 25MS/s (requires soldering extra headers to the board - not supplied). No protocol decoding as yet.

Requires an Android device with the Scoppy app installed (the premium features of the app will be automatically unlocked. Upgrading to the premium version of the app is not required).
See the Scoppy project on GitHub for the features of the Scoppy oscilloscope firmware and Android app